CHAPTER 8
So we are about ready to do some practical programming. The BIKE COMPUTER will be our model. Not that it is a brilliant piece of code writing, far from it. Let's say it is useful because it is a first attempt and the code is large and simplistic. But that is where it helps us, it is indeed simple to follow. The blocks are well defined and reuse of variables is minimal. Even so we have the advantage of being able to study a big program that works.
How does it work? As it is all written, we can use a flow chart to show the functional blocks. Lets make a simplified flow diagram of the bike computer. Here we see the main blocks only. The very necessary routines that do the calculations and respect the protocols for timing and data transfer to the LCD display are better described in the discussion of each module's features and operation.
As we read through the program listing, we will describe/ discuss the main points of the operation of the Bike computer program's modules.
These being:-
- Declaration of Variables
- Initiation of Ports and control registers
- Initiation of LCD
- Time and The automatic menu
- Speed
- Distance
- Average Speed
- Display routines.
The Flow-Chart
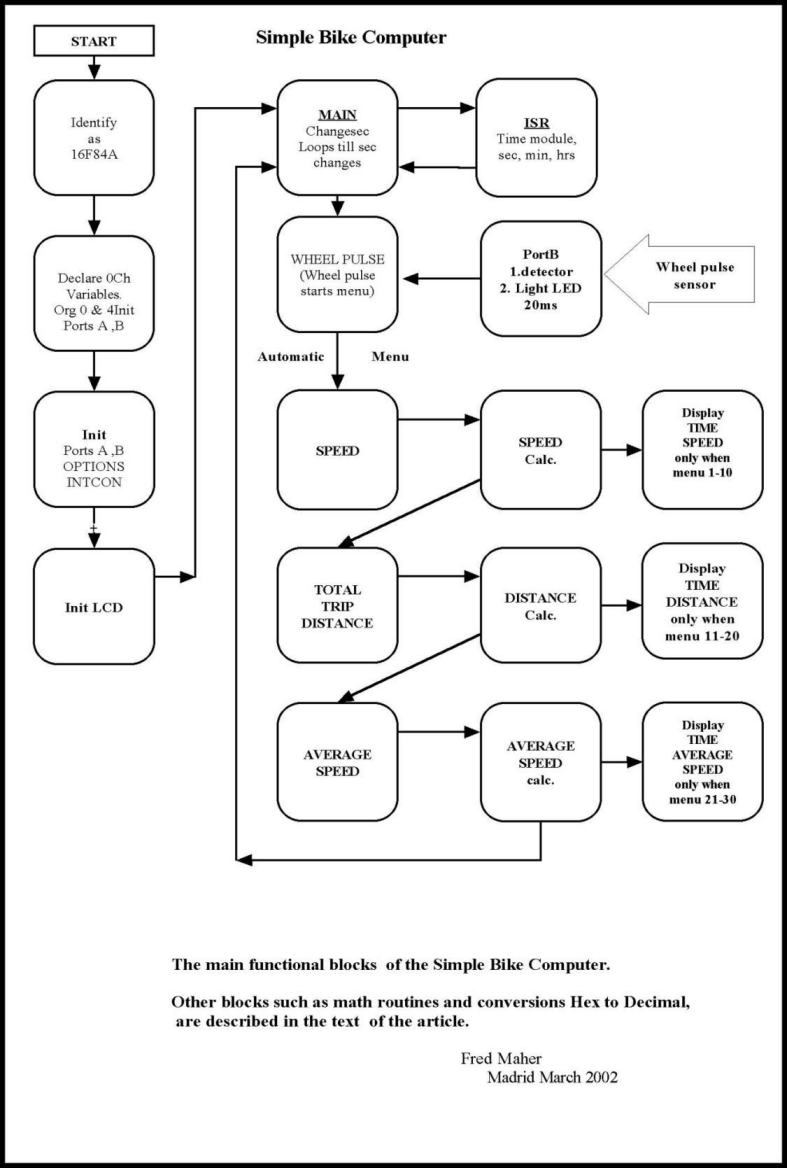
fig.30 flowchart
At last we have a flowchart in Fg.30 , which illustrates the major blocks of code within the bike3.asm program.
The diagram needs very little comment.
The action starts at the top left. There are a series of initiate routines, for registers, ports and LCD.
Once these have been completed we go to the top of the second column and are at MAIN. The firsts Label in main is Changesec. Changesec is the start of a cycle as it is the zero time reference for all the actions that follow.
It also implies that all that follows happens inside 1 second. This is true if the bike is moving faster than 6.4km/hr.
Resolution Available
We start as a new second occurs and lets us escape the CHANGESEC loop
We move on to the wheelpulse loop. How many pulses can we have in a second?
Well to get a feel for the real life quantities, 2pulses/sec =15km/hr,
4pulses/sec =30 km/hr. looking at this another way
Expressing these times in ms…
- 15km/hr interval between pulses = 500ms
- 30km/hr interval between pulses = 250ms
- 60km/hr interval between pulses = 125ms ….etc
There are limits to this system. It tends to give a jumpy speed indication above 50km/hr and ideally we should integrate taking the mean of several readings.
On the other hand there are few cyclists capable of maintaining more than 30km/hr on a level road as the HP you are using means that the quantity of calories needed rises very quickly to keep you going at these speeds.
Another factor is the resolution. Well this system detects ¼ ms intervals. This means for example that we can divide the time difference for the km between 15 and 30km/hr into 250 x 4 steps = 1000. Therefore we can display in steps of (30-15)/1000 km.
This 0.015km/hr. We could have a display then, like 15.28km/hr. But in the real world we don't need so much and would round to one decimal place 15.3 km/hr.
We were talking about the Wheel pulse measurement limitations. Now the normal sequence will be measure the time between two pulses. This is a large routine but not very hard to understand reading the notes beside each piece of maths.
What are two pulses? They are the sensor output each time the magnet passes it.
They represent a distance of 2.0747m But we use two and compensate every so often adding the ignored 0.0747m.
So speed is obtained from Distance / Time, here = 2.0747/( Pul2 – Pul1 )
The transformation to km/hr is simple, multiply the result, m/s, by 3.6
Just a little aside . The same incoming pulses flash a Green LED briefly. This does two things which are useful for debugging, but doesn't offer any other feature, except maybe at night, you could judge your speed from the cadence of the little green flashes.
The menu variable increases every second by 1
The top line of the LCD is always Elapsed Time
The Bottom line of the LCD changes according to the value of Menu
When menu is in the range 1 to 10 the LCD lower line displays Speed
- The Speed calculation and DISPLAY is repeated a maximum of 10 times. This means that Speed is displayed during TEN seconds
- Distance is Calculated.
- Average Speed Is Calculated
The Chart arrows lead us to Distance:
- Speed is Calculated
When menu is in the range 11 to 20 the LCD lower line displays Distance
- The Distance calculation and DISPLAY is repeated a maximum of 10 times. This means that Distance is displayed during TEN seconds
- Average Speed is Calculated
The Chart arrows lead us next to Average velocity:
- Speed is Calculated
- Distance is Calculated
When menu is in the range 21 to 30 the LCD lower line displays Average Speed
- The Average Speed calculation and DISPLAY is repeated a maximum of 10 times. This means that Average Speed is displayed during TEN seconds.
We then loop back and wait for a new second.
To sum up. Every second the menu loop calculates
- Speed
- Distance
- Average Speed
But only one of them starting with speed, is displayed during ten seconds before the display updates and shows the next parameter, Distance for ten seconds, then the next Average Speed for ten seconds.
30 seconds have passed and menu increases to 31. This triggers a reset.
Menu resets to zero and the cycle repeats, SPEED, DISTANCE, AVERAGE SPEED in an endless loop.
Well as we are confined to a 1second cycle for everything to be done. Are we in trouble trying to get everything done?
Fortunately the instruction execution time is nominally 1 usec.
The SPEED DISTANCE and AVERAGE SPEED modules are complete within about 2msec each when the numbers get big. This is worst case.
What takes a bit more time is getting the data onto the LCD, about 20ms. ( don't forget there are two lines).
So being really pessimistic we need 30ms to cycle the menu + 2 display lines
A second has 1000 ms. This means that we can only handle a maximum of 33 wheel pulses per second..
Is this enough? Well each pulse represents about 2m. If we con only handle 33 in a second, then the maximum speed we can measure is about 66m/sec
Or 237km/hr or 150mph. This would seem to be sufficient for all normal cyclists.
We read of them in the introduction and in various parts of the following chapters. The initial project had more facilities, but at a certain point, it was discovered that we had run out of memory.
The variables you can have directly are 67, The cblock holds them in continuous space from 0Ch to 4Fh. There are many things you can do to get more memory.
But this is supposed to be a SIMPLE bike computer, and using sophisticated circuitry hardly helps to write a clear easy to understand article.
That is why it was decided to stop with a minimal , but functional block of code. One of the compromises was to complete all the actions inside the second. If something took
longer, well that could be accommodated in the next version.
Also in the previous paragraph we mentioned mph. This was to be another option of the computer, display in Miles or in kilometres. It too will have to wait.


